Tuesday, 5 July 2011

CAN-Multiplexing worksheet

We used A 2008 Range Rover to do the next tests on.First thing we had to do was locate the twisted wire pair.I did this,and it was located by the ABS module loom.The wires were yellow brown and yellow black.I was asked to record the waveform of one of the wires

yellow brown:

This is the L-Can.The time per division was 5 micro seconds and the voltage per division was 1v.

Yellow black:
This is the H-CAN.I had a time per division of 5 micro seconds and a voltage per division of 1v.
Aliasing is jaggering,stairstep effect on curved or diagonal lines that are reproduced in low resolution as on a computer prinstious or division.This is how I got it on the dictonairy but it basically means that it is not clear.These waveforms are not aliasing because they are clear we have no trouble seeing and identifying them.
In the L-CAN the main voltage on the line is 2.5v.The other voltage is 1.4v.In the H-CAN has a main voltage of 2.5v and another voltage of 3.5v.this means voltage goes up to talk and on L-CAN voltage goes down.The reason for this is because the H-CAN more important.
compare with dc volts or ac volt setting:
2.6v
DC 2.3v
AC 0.1mv
Scan tool observation:
Stil using same vehicle.With a autoboss scan tool.
Different functions to examine can system:
controll unit version
fault codes
actual values(all selected)
actual values(manual selection)
actuations

different systems controled on can:
lights-low speed
wiper-low speed
washer fluid-low speed
central locking-low speed
airbag-high speed 
window-low speed
instrement cluster-high speed
ABS-high speed
mirrors-low speed
aircon-low speed

Above is the wiring diagram for the range rover fast CAN
Above is the wiring diagram for the range rover low speed CAN.
Got the pictures above from:
http://ttec4826-vlad.blogspot.com/2011/06/can-multyplexing-worksheet.html

Had to locate a system that goes to sleap after a short time.I found the can system does this.
voltage when the system is awake is 2.5v-2.6v.The voltage when system is asleep is 0.2mv.The voltage change on the yellow brown wire.Things like keyless entry is what wakes up the system when it is in sleep mode.

Honda multiplex system.

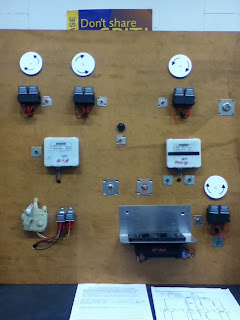
We were givin a honda multiplex board:
This is a picture of the board we used.The two white boxes in middle of the board is the nodes.the round white things are for the windows and their relays under them.The thing on the left at the bottom of board is the centralocking and it relays next to it.The big black thing at the bottom is the driver door node.This is what drivers use to open the windows and lock doors.The switch on top of it is the fault code switch and on the left of that one is the switch for the centralocking.


I used the wiring diagram above to identify the plugs and wire colours for communication lines between nodes:
MCU door=A15 to MCU (drivers) A2 is a brown wire.MCU (drivers) B1 to MCU(pasengers) B9 is a pink wire.
Earths and voltage supply lines between nodes:
Multiplex controll unit (door,drivers and pasenger)runs a pink wire from power to A1(door) A12(drivers) A24 (passengers)
We asked Scott to create a fault in the unit:
When this fault was created in this unit the drivers window was working but none of the other windows were working.The centralocking was also not working.This means that the comunication line to the units are not operating properly.Driver side was working because it does not go to nodes first it goes straight to window instead.
Next I had to use the wiring diagram to analyze the fault:
The comminucation lines are not connecting with the nodes so the nodes do not work.This could be because there is a break in the line.
I had to put the system in test mode.I did this and it came up with one short beep.The fault that comes up is the same as what I diagnosed it with before.
We cant do a continuity test because you can break it if you induse current into it when trying to test it.Therefore you are never aloud to use a test light on this circuit because it has almost no current in it.
We tested voltage for brown wire to unit and got a voltage of 0.2v so there is a high resistance so it is an open circuit.voltage with groun is stil 8.5v because they are still comunicatting.Pink wire was good.voltage flowing both ways so I got 8.3v on both sides with a 0.2v drop in the middle.
The door unit has no inputs to the drivers window because there is a break in the comunication line to drivers side.Has beep at the interior light so it is working.Unit not sending input to the nodes.
To diagnose I have to do a voltage drop test between A15 and A2.I did this and got a result of 8.7v at A15 and 8.5 at A2 so there is a voltage drop of 0.2v.this shows high resistance.
We were asked to put the system into sleap mode.We could not do this because the board we used was not wired up to do so yet.Sleap mode is used so the system does not flaten the batery when you turn the ignition of.

controlled area network board

We were givin a can system board with a list of things to do.

The picture above is a picture of the bored we were givin to use
Used an oscilloscope to capture the full pattern of the H-CAN and the L-CAN.The yellow wire is for the L-CAN and the blue wire is for the H-CAN.

I had to capture the data patern where it starts and stops.I did this by hoocking up the one to the blue wire from the H-CAN and hoock the other channel of the oscilloscope to the yellow wire for the L-CAN.


The top line is channel A.This channel is hoocked up to the blue wire H-CAN.The bottom line is channel B.This channel is hoocked up to the yellow wire wich is the L-CAN.The voltage division was 1.0v for both the H-CAN and the L-CAN. with the time on 25micro seconds.The relationship between the two patterns is  the base voltage is same thats why they are the same over eachother.The voltage is 2.5v.As the H-CAN is switche above 2.5v the L-CAN mocks this switching with an equal yet opposite voltage from the base voltage.

I was told to capture the paterns of the folowing inputs inputs:
Right indicator
Left indicator
Rear wiper
Stop lights
Fuel pump
Reverse lights


Right indicator
Left indicator

Stoplights

reverse light

In all the patterns above the voltage division was 1.0v for the H-CAN and 1.0v for the L-CAN and the time was on 25 micro seconds.This is the same as that of the original can.As we can see all the paterns shown above are alot differnt than the origal CAN the reason for this is because they all have to send out a different signal to know what has to turn on and when it has to turn on.The code is the amount of zeros.This changes with the different patterns.


rear wipers:
fuel pump:
the pictures above I got from:
http://amirs4825.blogspot.com/2010/11/controlled-area-network-board.html.
the reason I took his is because I didnt take picture when I did it


I used the Wiring diagram above to identify the inputs and outputs relays or transistors and wire pins and colours for the right hand indicator.
Right hand indicator indicator= 7-6
input voltage pin 7- tock I pin6 then output signal from RB2/can tx and Rb3/canRx to pins 1  and 2  then the output pins 7 CAN-H and 6 CANL to Ic4 and Can-L to can receiver IC5 and then the output pins TxD to TXCAN/TXRXCAN and RXD to RXCAN/NC and from the outputs GP4/REF and then to OPTOC coupling which switches the transistor which responds to light from the LED which then switches another transistor on which then finally switches the right hand indicator on.That is the whole proces of how the right hand indicator turns on did this by folowing the diagrame shown above.
Using the diagram I had to identify both the voltage regulator that resemble the one we built in ttec4824.They are similar because they change the voltage from a 12v supply to a 5v.Pin 1 and 2 input U2 7805 Pin 14 VDD.

ABS wheel speed sensors

I did the folowing tests on a daihatsu.The wheel sensor on this vehicle was a analogue type.I found that this was a analogueb type sensor because it had 2 wires goin to it and a digital type usaly has 3 wires sometimes more.I used the back wheel sensor because I coul not get to the front ones plug so was not able to see the amount of wires going to it.I was asked to measure the air gap for each wheel sensor.I could not do this because ther was a plate in the way and I did not have any tools to remove this.


This is an example of the type sensor the  vehicle I used had.
http://www.google.co.nz/imgres

I used a oscilloscope to get the patern for the wheel sensor.


This is A analogue pattern as I talked about before.
had it at 0.5v and 20ms

Monday, 4 July 2011

Using a scan tool

We used a scan tool on a 1997 mitsibitchi galant.The first thing we did was to go on to the ABS life data and record all the sensors:

Front right wheel speed sensor
front left wheel speed sensor
rear left wheel speed sensor
rear right wheel speed sensor
brake light switch

After doing this I went to the actuator test screen and listed the tested components.
solenoid valve 1
solenoid valve 2
solenoid valve 3

Next thing we did on this car was the electronic transmission
First we had to know what everything means.
PCM:powertrain control module
TCC:Torque converter clutch
TPS:Throttle position sensor
ECT:Engine coolant temperature
VSS:Vehicle speed sensor
PSA:transmission range fluid presure switch asembly
TTS:transmission temp sensor

I used the workshop manual to get all the sensors and actuators.

I also got the wiring diagram for the system.

Got the pictures above from:
http://amirs4825.blogspot.com/2010/11/electronic-transmissions-and-scan-tools.html

I used the folowing diagram to answer some question that was asked.


Was aked which solenoid are on when the vehicle is shifted ibto drive and starts in first gear:
2nd and OD
which solenoids are on when the vehicle automaticaly shifts into second gear:
OD and LR
which solenoids are on when the vehicle automatically shifts into third gear:
LR and 2nd
which solenoids are on when this vehicle automatically shifts into fourthb gear:
LR and UD

I got all these results by looking on the chart showen above
If there is a shift solenoid malfunction and vehicle is stuck in a high gear it would want to stall and when stuck in a lower gear like first wont be able to go fast probably only about 60kmph in most cars.

I used the repair information to pick two codes.
code 58
transmission fluid temoerature
to repair this fault I can check for voltage drop at the signal wire and compare the signal voltage to the manufacturers spec.

code 82
1-2 shift solenoid circuit faulty.

to diagnose this fault I can check all the earths to make sure I have a good earth and see if I hav a high resistance.

ABS Relays

The name of the relay that powers up the ABS ECU.I got it on the wiring diagram.
k39(protection relay)

ABS pump relay:
k100(pump motor relay)

ABS HCU solenoids relay:
y22(hydraulic modulator relay)

ECU pin number for wire that gives power to ABS ECU:
26(A)

ECU pin number for wire that controls relay for ABS:
1(B)

ECU pin number for wire that gives power to the ABS pump:
8(E)

ECU pin number for the wire that controls ABS pump relay:
2(H)

I got all the relay names and ECU pin number by using the wiring diagram and folowing it.

I used a oscilloscope to capture the waveform that shows both the controll circuit change and power switching.


I got this picture from:http://amirs4825.blogspot.com/2010/11/abs-relays.html

channel 1(the bottom one) is the controll circuit and channel 2(the top one) is the switching circuit.Point A is when the switching circuit turns on and goes from 0v to 12v.B is when the switch is open,this is when the switching circuit is open.Point c is when the control circuit has collapsed we ca also see a voltage spike at this point.Point E and D is when the pump has been turned on and off.

ABS pump relay waveform:
 had to get waveform of control circuit changes when relay turns on and the power switching on to power on the ABS pump.


To get this waveform I had to conect HC11 to power 85 and hotwire 30 shows the top one and 85 is the bottom one.On chanel B(the top one.)were it goes up is were its turned on and the top part from corner to corner shows that ECU is earth trigerd.Then at the second time when it goes up again is when the key is turned off.Then at the bottom one where it goes up is when ABS pump spiking.When down again is when signal switched.

ABS self test:
To make sure all the components in the ABS system are workin it has to do a selftest,it does this test when we turn the ignition on.It has a 12v supply.The ABS control module checks most of the components in the circuit exept for the components it can not check like the wheel speed sensors wich cannot be checked unless the car is moving.If the ABS controll module does not triger the failsafe relay the ABS light on the dash will not go of.This wil indicate that the module has found a fault in the ABS system.

Create a fault:
I did this by slowing down a wheel speed sensor while aplying the brakes.I did this by using a piece of plastic pipe and pressing on wheel while braking.The modulator can see this because one wheel slowin down faster than the rest of them so senses tha it is going to lock up.It stops this from hapenning by opening the inlet valve with a solenoid so there is no more presure being applied.

ABS solenoid actuated:


On this diagram we can see all the pin number and solenoid names.for example were it says solenoid LF means lef front solenoid then the wire that goes down to circile tha say 1B is the pin number for that solenoid.
Left front solenoid:
pin:1B
right front solenoid:
pin:1C
Left rear:
pin:1D
right rear:
pin:1A

I got the waveform for this on oscilloscope for the left front solenoid.

It is a solenoid therefore it looks like an injectors waveform they also share some of the same qaulitys.

ABS Demonstrators


I used the wiring diagram above to find the wheel speed sensor pinout connections to the ecu.

left front:
ecu pin:4 and 5
left rear:
ecu pin:7 and 9
right front:
ecu pin:11 and 21
right rear
ecu pin:24 and 26

The type of speed sensor in this ABS unit is a magnetic inductor type sensor.It works with a passing magnet induses current through the windings.It has a magnet that creates a magnetic field.
Iused a tech tronic oscilloscope for the following tasks.

I had to get the osciliscope waveform for each of thewheel speed sensors.
The first sensor I did was the front right

front right
front left:

left rear:


right rear:


I got all the waveforms above from:http://amirs4825.blogspot.com/2010/11/abs-demonstrators.html
The waveforms arnt all the same,the left side looks identical and the right side also looks identical but the right side voltage is alot higher than the left side.

with wheel speed sensor spinning I measured the ac volts and got result of:

left front: 3.593v
left rear: 2.695v
right front: 4.473v
right rear: 5.141v

A multimeter wont be as acurate as a oscilloscope.The advantages of using a oscilloscope is that an oscilloscope shows a patter/waveform,this waveform can show you the maximum voltage outputs,peak to peak voltage and frequency ect.These waveforms allow you to visually see any faults in the circuit being tested,can aloso show changes in the circuit.If you are able to read these patterns it makes it alot more simple and acurate to diagnose fault vurther than using a multimeter.

antilock bracking systems

First we looked at some posible causes of damaging  an ecu,these are some of the causes:
Spiked by careless welding like mig welding without disconnecting the battery.
Enclosure seal damaged and with obvious sign of water ingress.
Obvious signs of mechanical damage to the enclosure.

When a inexperienced technician tries to fault find an ecu it might be misdiagnosed.Faults in ecu is more likely to be with connection or sensors.If these issues would occur with the ecu it might cause the abs to not work because there is a lack of comunication in the system

First task was to identify the components in the system


1=brake disc
2=speed sensor
3=tooth wheel
4=modulator
5=master cylinder
6=caliper
7=brake booster


Next I used the wiring diagram above to get some information about the abs.First I found the sensors on the diagram and list their colours:
Front right: -white  +black
Front left:  -green   +red
Rear left:   -pink     +blue
Rear right  -brown  +yellow


ABS wheel sensors has braded wire,the reason for this is to sheild other wires from frequency and for interferance.
there is a list of fuses in the abs circuit:
warning light fuse
stop light fuse
battery fuse
ignition fuse
abs fuse
battery main fuse

using the wiring diagram again i was told to identify the earths for abs wire colours and pin numbers
pin-10 white black
pin-7 white black

I was told to identify the solenoids control wich wheel cylinder:
Front right wheel
pin number:2B and 6B
wire colour:red white and red green

Front left wheel:
pin number:3B and 7B
wire colour:blue red and blue white

rear left wheel:
pin number:1B and 5B
wire colour:Brown red and brown white

rear right wheel:
pin number:4B and 8B
wire colour:Green black and green yellow

 Next task I had to do was use the picture above to give the conditions of the inlet and outlet valve solenoid valves:
abs operating to hold brake pressure
inlet valve closed outlet valve closed.

ABS is operating to increase wheel brake presure:
inlet valve open outlet valve closed.

under normal braking:
inlet valve open outlet valve closed

abs is operating to reduce brake pressure:
inlet valve closed outlet valve open.

The abs motor wil start to work when the car is locking up.It knows when this is goin to happen with the use of wheel speed sensors at each wheel.

I had to draw a digital signal that switches 5volts every two seconds.

As shown in this graph we can see after 2 seconds voltage goes up to 5v this is when it switches.It stays 5v for 2seconds then comes back down to 0 this is when it switches again.

I also had to draw a analogue signal with a frequency of 0.5Hz and a maximum of +3 volts

I got this picture of http://ttec4825rex.blogspot.com/2010_10_01_archive.html As we can see in this graph only goes up to +3 volts shown on left and comes down to -3 volts

Wednesday, 15 June 2011

Primary and secondary ignition patterns

I had to use a lab scope to get the primary ignition patern with the engine on idleing.I did these following tests on the 4A-FE engine.My task was to record the average firing voltage,the avarege burn voltage,average burn time and the average dwell time.I had to do this for each cylinder.

                              cyl1         cyl2          cyl3        cyl 4
firing voltage          248v        248v        248v       248v
burn voltage          55.6v       55.6v       55.6v      55.6v
burn time              1.48ms     1.48ms     1.48ms   1.48ms
dwell time             6.2ms       6.2ms       6.2ms     6.4ms

all these voltage reading are normal because they are all the same or when not the same they are very close together.This shows a good steady primary ignition voltage.


In this oscilloscope patern it shows the charge and discharged pattern of the coil.As seen in this pattern it drops shows the dwell the it rises by alot,this shows the burn time.The burn and dwell time is both measured in ms.the voltage division of this pattern was 5v and time was 1s.

Using stacked display is an advantage because it makes the pattern more accurate can see the voltage the voltage drop and rise more acuratly.
Next task was to view secondary ignition patern.I was asked to record the firing voltage and the burn time for each cylinder.The first one I had to do was under snap accelaration.

                                cyl1            cyl2                cyl3            cyl4
firing voltage            5.4kv          6.2kv              5.9kv         6.2kv
burn time                 1.1ms          1.8ms             0.65ms       0.71ms
snap acceleration     9.8kv           8.4kv             9.8kv          9.0kv

In this result it shows that the secondary is not as consistant as the primary but not bad either.Also shown is that it does not hav the dwell time.

The picture above is the pattern of the snap acceleration secondary ignition.The middle part were it goes up is the part were we reved the engine.This is were the firing voltage is calculated.This picture is of cylinder1.This is similar to the primary but the fact that secondary does not read dwell time makes them different

Next on was with a spark tester.Do this by ataching a spark tester to sparkplug wire

                           Cyl1           cyl2           cyl3        cyl4
 firing voltage       13.9kv        6.4kv        6.4kv      6kv
 burn time            0.7ms          1.41ms     1.12ms    1.4ms

In this results it shows that the voltage goes verry high on cyl 1 but the drops and stays steady and at this time the burn time is lower.This is because the spark tester was on cyl 1

voltage division in this one was 4kv and time was 8.7ms.In this picture it shows that it has one spike.this is where it sparked and where the voltage was higer and the time was lower.

Tuesday, 14 June 2011

exhaust gas analysis

This was done on a 1992 nissan primera.To do these test I had to use a exhaust analyser.Before I could use it I had to warm it up and calibrate it.When this process was done I put the analyser probed in the tailpipe.First I ha to know what everything means:CO2=carbon dioxide.These readings indicate that the catilatic converter is working.CO=carbon monoxide.These readings indicat catalatic converter is not working and if car is rich, HC=hydro-carbon.this shows about the misfire in the engine.O2=oxygen.this shows if car is rirch or lean.

The first test I had to do was start the car and let it idle cold and record the readings.It usaly takes about 30seconds for a acuarute reading to show.I got readings of:
CO:49%  HC:340ppm  CO2:12%  O2:0.6%
The engine getting warmer but the catalytic converter stil cold that is the reason for the CO reading being higher than normal.The HC is also high this indicates a high number of missfire.this is also because car i still cold.

The next reading i had to take was when the car is warmed up.
CO:6% HC:171ppm CO2:12.8% :O2:0.08%
This result indicates that the catalytic converter is not working efficiently.The hc number has come down alot because the car is at a good tempreature and steady went into closed loop so idles better.

Next reading was at 2500 rpm
C0:39%  HC:245ppm  CO2:12.8%  O2:0.16%
The HC number has gone up again because we increased the revs so the misfire count went up because it is at higher rpm more strain on engine.CO is still high shows the catalytivc converter is not working properly.

Next task was to make the car run rich and record reading.I did this by spraying a little carberator cleaner into the intake.
C0:7.7%  HC:1800ppm  CO2:14% O2:-O.O2%
The CO has still not realy improved.The hc in this one is verry high which sows a verry high amount of misfire.The O2 is verry low.this show that the car is running rich.

Next I had to make the car run lean.I did this by removing a vacuum hose.
CO:0.3%  HC:1400ppm  CO2:7.8%  O2:9.8%
In this one the CO is good.The HC is still very high because it is running lean the missfire number is high.The O2 is realy high.This shows that the car is running lean.

I had to accelerate for a short time and record readings when CO is reading highest.
CO:4.2%  HC:240ppm  CO2:13%  O2:0.15%
The CO at its highest reading is not verry high.This shows that the cat is working.the missfire number pretty high because rpm increased.The O2 reading is good car not running to lean or rich.

Next I had to disconnect a spark plug and ground it.
CO:15.2  HC:1900  CO2:13.7  O2:0.9
In this task the missfire number was verry high because it is only running on 3 cylinders.The CO is getting higher this indicates the catalytic converter is trying to work.

I had to disconect one injector.
CO:1.8  HC:282  CO2: 10.3  O2:5.3
Cat converter working pretty good in this test.O2 reading hig indicates that the engine is running lean because with the one injector disconected engine is not getting enough fuel

Made other changes do see diference.The changes i made was I turned the aircon on.
CO:3  HC:240  CO2:13.1  O2 0.14
Only thing that quite hig in this test was the HC but not to high.

If I did all these test on a vehicle without a catalytic converter the readings for CO and O2 will be higer because it will run lean.lambda O2 sensors has 4-5 wire because extra wires are used for signal wires.

This is a picture of what it looks like to get the reading on the analyser.

Monday, 13 June 2011

oxygen sensor on car

I did the following tests on the 1zz engine.On this engine this sensor was located on the exhaust manifold just when it goes into one pipe.This sensor has 4 wires:
colour                                 use
white                                  signal
white                                  O2 sensor
white                                  ground
black                                 power heater

The sensor I was working with was a zirconia switching sensor.I had to hoock up a oscilloscope to the sensor to get a patern.I did this by back-probeing the signal wire and putting my oscilloscope to it.My first task was to get a pattern at 2500rpm.With this pattern I found that the higher the voltage gets the richer it is.


The voltage goes as high as 0.715v and it goes as low as 0.1v.The average voltage was 0.6v,the oscilloscope had a function to calculate this.This sensor had 3 cross count.One cross count is when it goes from low to high or high to low.

My next task was to get a pattern of the oxygen signal at idle in closed loop.Closed loop is when car is warm and the ECU uses actual information to adjust sensor and not a set map like open loop.


In this one the voltage only went up to 0.2v and went to as low as 0.1v again.0.15 was my average voltage and again it had 3 cross counts.

In the next task I had to make my oxygen sensor go rich and get the pattern.I did this by giving it a quick accelaration.


This gave out a higher voltage of over 0.85v.If this did not give a high voltage the voltage will be changed and will not give a good wave form.

Next thing I had to do was make the oxygen sensor go lean.I did this by running the rpm to 3000 then sudenly dropping the throttle.


The voltage dropped from 0.8v to 0.1v.This shows us the lower the voltage the leaner the car is running.If the voltage is not high the waveform will be bad and wont go down as low as it should.

Next thing I did was measuring the response time I did this by sudenly acceleratin to see how quickly the sensor went from lean to rich.


The voltage went from 0.1v all the way up to 0.8v the bottom is at idleing the goin up is at accelerating and the top is when it is rich.It took the sensor 100ms to go from rich to lean


The zircronia sensor is based on a solid-state elctrochemical fuel cell called the nernst cell.On this system when the voltage is 0.2v this indicates a lean mixture and at 0.8v it indicates a rich mixture.It is most sensitive near stiochmetric point and less sensitive when rich or lean.

this is a good picure of http://www.wikipedia.org/ to show how the sensor works.

Sunday, 12 June 2011

scan tool diagnostics

We did this on the 1zz engines.We were given a scan tool.

<>
first I had to know what the folowing means
Letters to describe it
Value of data
Units for data
Engine Load(how much air comes in)
AFM(MAF)
2.58
Gm/s
Engine RPM
Engine speed
700
RPM
Throttle angle
Throttle position
11
%
Engine coolant temperature
Coolant temperature
71
C
Intake air temperature
22
C
Fuel Injection opening pulse
Injector pulse width
2.7
ms
Transmission select position
shift
4
Vehicle speed
0
0
Km/h
Oxygen sensor(s)
O2 sensor B1 S1
0.89
V
Fuel Trim
Short fuel trim#1
-20.3
%
Idle control
IAC duty ratio
37.5
%
Power steering condition
PS
off
Air Conditioning condition
A/C cut signal
on
Exhaust Gas Recirculation(EGR)
-
-
-
Fuel Evap or Purge condition
EVAP VCV
OFF
-
Malfunction Indicator Light
Warning light/MIL
on
on

I got this information from http://ttec4826-vlad.blogspot.com/2011/05/scan-tool-diagnosatics.html


I plug the scantool in to the diagnostic plug the I got the lecturer to create a fault.He did this and after selecting the vehicle and engine on the scantool the fault code came up.The code number was po120 I looked it up and found that it was the tps.The lecturer switched this of.By doing this he had caused a circuit malfunction.After this I had to find out what parameter identification of system voltage(pid)has changed. the type of informayion is throttle position letters to describe this is tps value of data is 0 units for data is % I did this with ignition on.I did a visual inspection to find the fault.To do this I checked for corotion,I checked plugs to make sure they are in properly.I checked all the wires and chech yhe voltage.I found that there was a circuit malfunction and when i could not repair it I got lecturer to turn back on.On the tps the yellow wire is the 5v supply the brown is the reference and the green is the signal wire.To clear the codes I said clear codes on scantoolI turned the ignition of. to recheck the codes I turned ignition on again and no codes came up.Live data is important because it shows faults and changes in the system and what is happening with the faults in the system.parameters is needed when checking live data because it shows changes and what is hapening in the system.A scan tool can aid you when fault finding because it is acurate and tels you what is wrong to be able to fix the car faster.

Dual trace oscilloscope

Doing the dual pattern works the same as doing the normal one but you just get two paterns.I still used the same oscilloscope but but went to menu and turned patern b on this makes it posible to see two patterns.hooking it up was not hard.I used one earth that went in the bat- terminal on the 1zz engine and then I had two red wires in two diferent terminals of the osciliscope then I put them in the terminals of the sensors patern that i wanted.When i got goo paterns I pased them and got the result.This can also be done with two oscilloscopes if needed.

The first pattern I got was map against injectors.The voltage for the map was 1v and voltage for injectors was 20v.For this one I used two oscilliscopes.The reason for this was because the map is alot slower than the injectors so I couldnt realy get a good reading for them together.So I used two earhts and started them same time and paused them at the same time aswell to get a good afective pattern

The left side is the injector and on the right hand side is the map.on injectors bottom line is burntime and goin up is charging and on the map as it goes up its getting more air.The two components relate to eachother because.When the map sensor goes up it means it is getting more air.This means the injector will spray more fuel because the ECU can see there is more air so there has to be more fuel.There is also more frequency at the injector when there is more air.the higher the map signal is the bigger the burntime of the injector would be because when it goes higher it gets more air so it needs more fuel.The components affect eachoter because if the map is faulty the air reading might be wrong so it wont spray right amount of fuel and it would make the car run badly.

The next pattern I did was for rpm crank vs injector.For this one I used one iscilloscope because it was all i needed.The voltage for the rpm crank was 10v and the voltage for the injector was 50v.When I first did this it did not work then I realized the crank sensor was not connected so I moved to another engine.


The bottom pattern is the rpm and the top patern is the injector.I had the time on 2ms.in the injectors were it goes doen between that and before it goes up again is burntime.with the rpm top is peak point.If I ad throttle the gaps between waves of rpm wil opn more.These components relate to eachother because as soon as the crank meets the o point the injector switches on.The slower the time which was 2ms in this time the bigger the burntime of the injector.This means that the components can affect eachother in a big way because if the crank sensor is faulty the injectors wont turn on when it should and cause the car to run badly.

The next pattern was for oxygen sensor against injectors.I did this one on a 4a-fe engine.

I had the oxygen sensor voltage on two volts and the injector voltage on 10v and the time on 5ms.the injector stil same. the oxygen sensor does not do much because the o2 sensor not as fast as injecor.These components relate to eachother because the oxygen sensor measures the gases and sends to ecu and makes injectors spray more or less.If there is a faulty O2 sensor the injectors might spray too much or too little fuel.this would cause the car to run lean or rich and could cause it to use more fuel.

The next pattern I did was for ignition primari against injectors.


I had the voltage of the injectors on 20v and the ignition on 5v with the time on 5ms.In this pattern the two wave forms are directly above eachother like the burntime of the injector is even with the ignitions time.when we rev the car the ignition goes up aswell as the injector pattern.these relate to each other because when ignition goes up injector sprays.This means if the ignition faulty the burntime of the injector will be wrong and the car will run badly might also run rich and use more fuel.

The last patern I did was ignition primary voltage against ignition primary current


The current rises as the primary circuit is completed as it show in this pattern the top one is the current and the bottom is the voltage of the primary ignition.I used a ohmmeter that i hoocked up with the oscilloscope to get the current pattern.